EXCEL: CHARTING EXPERIENCE
Designing a new charting experience in Microsoft Excel with intelligent features and optimized user flow.
THE PROJECT
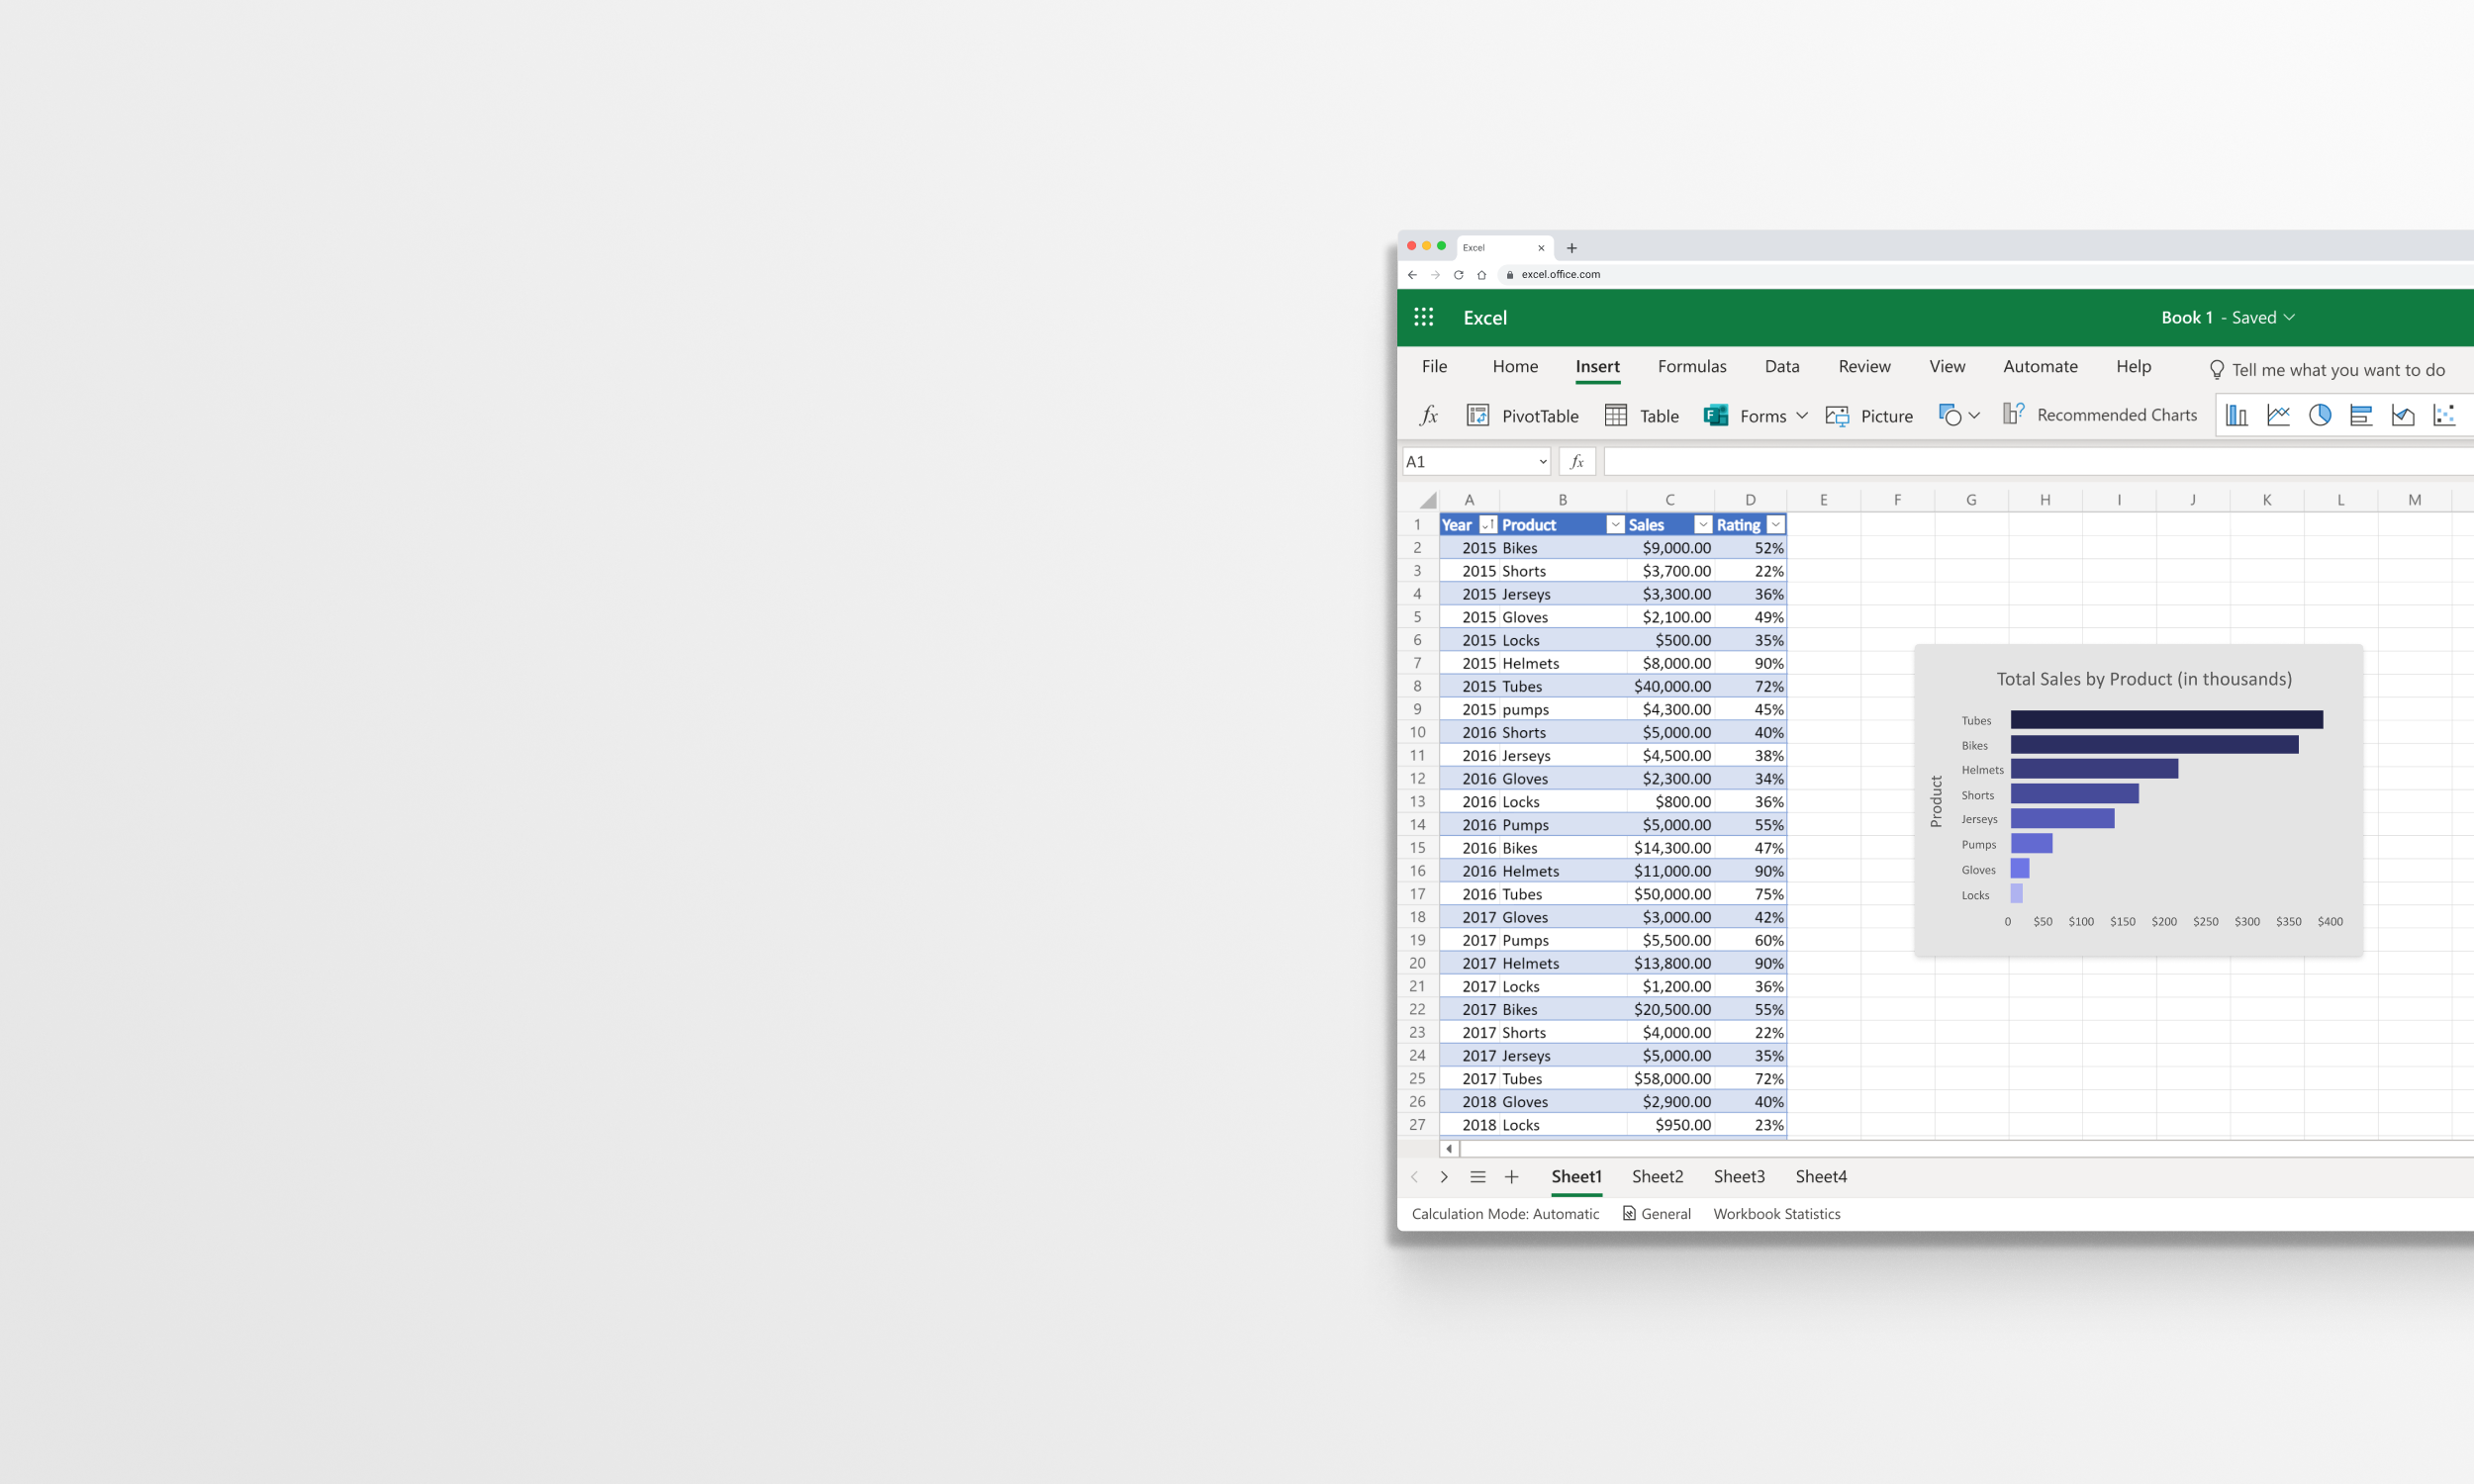
Creating and modifying charts is one of the major uses of Excel for millions of users. With intelligent features like Recommended Charts, Excel is invested in making the charting experience easier for customers who may not be data visualization experts or power users. I was tasked with a design project to improve the user experience and flow for charting in Excel. As part of this work, I created many explorations within the Excel design system and existing patterns, developed prototypes, and tested with users.
MY ROLE
UX Designer
DURATION
Ongoing
THE TOOLS
Figma
COMING… ONE DAY.
THIS IS AN ONGOING PROJECT AND CURRENTLY UNDER N.D.A.
